It’s been years since I started using Google Calendar to keep track my sports activities. I guess there are countless apps to do this but all I needed is something basic that I can access from anywhere. Since I already have synced my iPhone with Google Calendar, I can basically enter data from wherever I am, even if there is no internet connection, and then have it synced back to my main repository on Google servers as soon as I’m back online.
So what I did is a little Python script that gathers all this data and spits out a few statistics and graphs.
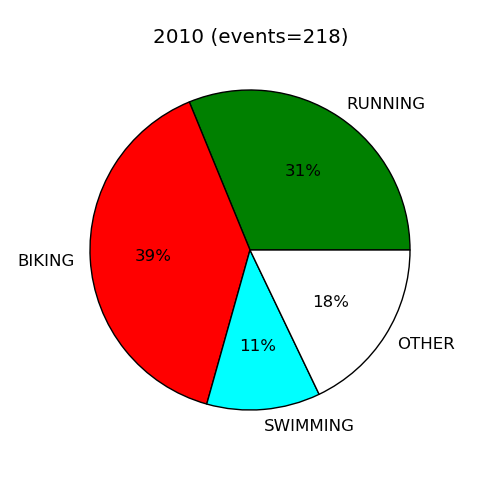
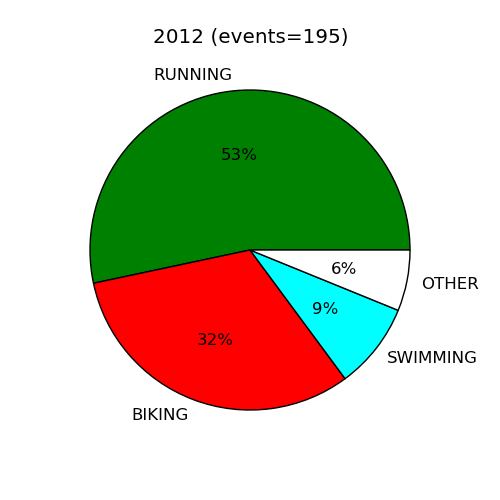
First however I need to explain what are my conventions to enter my activities in Google Calendar. I have four main categories: running, biking, swimming and “other” (which includes things I used to do but don’t do anymore or other occasional outdoor activities).
Basically I enter in my calendar an event that begins with “B” for biking, “S” for swimming, “R” for running. All the other activities that I enter are classified in the “other” category. Now I use a separate calendar to enter all of these items (aptly named “Sport”) — and I suggest you do the same if you also use Google Calendar for other purposes. In the script below however I have set the calendar name to the default, so you may want to change that name using the calendar ID1.
These are two examples of the yearly reports:
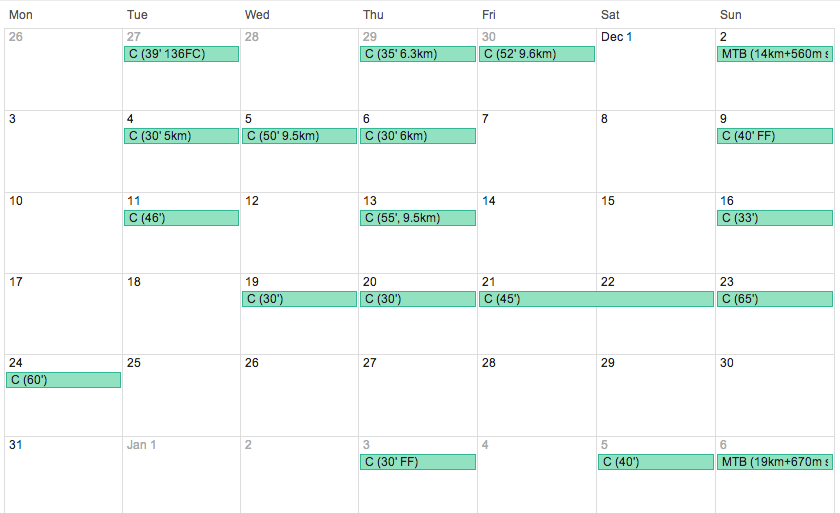
And this is what a typical month looks like in my Google Calendar (there is some differences in the codes that I use because for example I enter “C” for corsa, which is the italian for running; likewise I have two separate categories for biking, “B” for road biking and “MTB” for mountain biking; in the script however I have simplified the categories and only included one). You can also notice how I write additional info like duration and length whenever possible; someday I’ll get around to do a Python script also to collect and make stats on this information.
Finally, here’s the script (please read the notes below):
from pylab import *
import getpass
import gdata.calendar.service
import gdata.service
import gdata.calendar

def main():
    username = raw_input("Enter your username: ")
    password = getpass.getpass("Enter your password: ")
    inizio = raw_input("From year: ")
    fine   = raw_input("To year: ")
    intervallo=range(int(inizio),int(fine)+1)

    calendar_service = gdata.calendar.service.CalendarService(username,password,"prova-cal")
    try:
        calendar_service.ProgrammaticLogin()
    except gdata.service.BadAuthentication, e:
        print "Authentication error logging in: %s" % e
        return
    except Exception, e:
        print "Error Logging in: %s" % e
        return

    for anno in intervallo:
        start_date=str(anno)+'-01-01'
        end_date=str(anno)+'-12-31'
        calname='default'
        lista=DateRangeQuery(calendar_service,start_date,end_date,calname)
        lista=sorted(lista)

        corsa=bici=mtb=nuoto=altro=0
        for x in lista:
            if x[11:13] == 'R ':
                corsa+=1
            elif x[11:13] == 'B ':
                bici += 1
            elif x[11:13] == 'S ':
                nuoto += 1
            else:
                altro += 1
        totale=float(len(lista))
        print '---> YEAR '+str(anno)
        print 'running:  %3d (%2.0f%%)' % (corsa, (corsa/totale)*100)
        print 'swimming: %3d (%2.0f%%)' % (nuoto, (nuoto/totale)*100)
        print 'biking:   %3d (%2.0f%%)' % (bici,  (bici/totale)*100)
        print 'other:    %3d (%2.0f%%)' % (altro, (altro/totale)*100)

        nn=[corsa,bici,nuoto,altro]
        mycolors=['green',   'red',    'cyan',     'white']
        mylabels=['RUNNING', 'BIKING', 'SWIMMING', 'OTHER']

        figure(figsize=(5,5))
        axes([0.1, 0.1, 0.8, 0.8])
        pie(nn,autopct='%1.0f%%',labels=mylabels,colors=mycolors)
        title(start_date[0:4]+' (events='+str(int(totale))+')')
        show(block=False)

def DateRangeQuery(calendar_service, start_date, end_date, calname):
    aaa=[]
    query = gdata.calendar.service.CalendarEventQuery(calname, 'private', 'full')
    query.start_min = start_date
    query.start_max = end_date
    query.max_results=5000
    feed = calendar_service.CalendarQuery(query)
    for i, event in enumerate(feed.entry):
        name=event.title.text
        for a_when in event.when:
            time=a_when.start_time
        aaa.append(time[:10]+','+name.upper())
    return aaa

if __name__ == "__main__":
    out=main()
    show()
A few notes about this script:
- This is tested on Mac OS X using the latest Canopy installation.
- You need to have the gdata Python library installed. There is a way to avoid importing the library altogether2. What you need to do is just to make the
gdataandatomsubdirectories that you find belowsrcafter unpacking the tar.gz available in the directory where you run the script. By the way, I have usedgdata-2.0.18.tar.gzwhich is the latest version at the time of writing. - Another way to avoid installing gdata but keeping things a bit more organized is to keep the gdata folder stored somewhere and then add its path by inserting these two lines at the beginning:
import sys
sys.path.append("~/Documents/_PROG/PYTHON/gdata-2.0.18/src/gdata")
- For some reasons however the above method only works if I run the script from within Canopy and not from Terminal. I have no idea why and I have no intention to spend any more time investigating this little bugger.
- This script works from the terminal by typing
$ python gcal_sport.pyor whatever you want to call this script. To make the plots persistent I had to add theshow(block=False)in the main function andshow()at the end of the script. If you run it under iPython (Canopy for example uses iPython) then you can get rid of theblock=Falseoption and delete the lastshow()line. - I’m not a huge nerd but I can make this stuff work. I wanted to share this script because I find it useful and maybe some other poor devil will find some use for it. The point is that I have no intention nor time to help Windows users, or people that don’t even know what Python is. For all of you sane people please go see my photographs instead.
-
First you have to get the calendar ID. If you go into your calendar and click on the down arrow icon next to the name you will see an option for Calendar Settings. Select that menu item. Near the bottom you will see Calendar Address. It will take a moment to find the Calendar ID and it will look something like
o4g3921hdiaq5p8kdat2l4vgis@group.calendar.google.com. (from http://stackoverflow.com/questions/555468/how-do-i-insert-into-non-default-google-calendar-using-zend-php). ↩ -
I had to find this workaround because in Canopy Express (the free distribution) you can not install through the package manager some less used libraries such as gdata. ↩